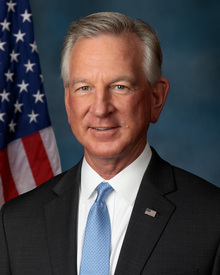
Tommy Tuberville stock trades
Republican · Senator from Alabama
In Congress since 2021
Tommy Tuberville has disclosed 1,314 trades since 2021, most recently on Jul 16, 2026. Tuberville's most-traded stocks are CLF, X and PYPL. 6 trades were in an industry overseen by a committee Tuberville sits on. 104 were reported after the 45-day deadline. Over the past year, a portfolio of Tuberville's disclosed stock trades returned an estimated +0.2%, against +12.4% for the S&P 500.
- Trades disclosed
- 1,314
- Buys / sells
- 545 / 769
- Reported value
- $18.5M–$56.8M
- Committee overlaps
- 6
- Stocks traded
- 288
- Late filings
- 104
- First trade
- Jan 4, 2021
- Last disclosed
- Jul 16, 2026
Estimated returns
How a portfolio built from Tuberville's disclosed stock trades would have performed, next to the S&P 500.
Show as a table
| Date | Tuberville (est.) | S&P 500 |
|---|---|---|
| Nov 11, 2025 | +0.0% | +0.0% |
| Nov 18, 2025 | −4.1% | −3.4% |
| Nov 25, 2025 | −2.7% | −1.2% |
| Dec 3, 2025 | −0.8% | +0.1% |
| Dec 10, 2025 | +0.2% | +0.7% |
| Dec 17, 2025 | −3.0% | −1.7% |
| Dec 24, 2025 | −1.2% | +1.4% |
| Jan 2, 2026 | −1.2% | +0.3% |
| Jan 9, 2026 | +0.5% | +1.9% |
| Jan 16, 2026 | +2.7% | +1.6% |
| Jan 26, 2026 | +3.0% | +1.7% |
| Feb 2, 2026 | +1.0% | +2.1% |
| Feb 9, 2026 | +1.7% | +1.9% |
| Feb 17, 2026 | +0.4% | +0.3% |
| Feb 24, 2026 | +1.5% | +0.9% |
| Mar 3, 2026 | −0.5% | −0.1% |
| Mar 10, 2026 | −1.3% | −0.6% |
| Mar 17, 2026 | −1.2% | −1.5% |
| Mar 24, 2026 | −3.9% | −3.8% |
| Mar 31, 2026 | −4.3% | −4.2% |
| Apr 8, 2026 | −3.0% | −0.5% |
| Apr 15, 2026 | −0.8% | +3.1% |
| Apr 22, 2026 | −0.2% | +4.7% |
| Apr 29, 2026 | −2.5% | +4.8% |
| May 6, 2026 | +0.5% | +8.1% |
| May 13, 2026 | +0.0% | +9.3% |
| May 20, 2026 | −1.3% | +9.1% |
| May 28, 2026 | +1.4% | +11.1% |
| Jun 4, 2026 | +1.1% | +11.5% |
| Jun 11, 2026 | −1.1% | +8.6% |
| Jun 18, 2026 | −0.8% | +10.2% |
| Jun 26, 2026 | −2.0% | +7.6% |
| Jul 6, 2026 | −0.0% | +10.9% |
| Jul 13, 2026 | −0.6% | +10.6% |
| Jul 20, 2026 | −1.2% | +9.6% |
| Jul 27, 2026 | −1.9% | +9.1% |
| Aug 3, 2026 | −0.8% | +11.9% |
| Aug 10, 2026 | +4.0% | +14.1% |
| Aug 17, 2026 | +4.3% | +14.1% |
| Aug 24, 2026 | +4.7% | +12.7% |
| Aug 31, 2026 | +4.0% | +13.2% |
| Sep 8, 2026 | +3.4% | +13.1% |
| Sep 15, 2026 | +0.9% | +11.8% |
| Sep 22, 2026 | +3.9% | +14.5% |
| Sep 29, 2026 | +0.8% | +13.1% |
| Oct 6, 2026 | +1.9% | +15.3% |
| Oct 13, 2026 | +1.4% | +15.1% |
| Oct 20, 2026 | +0.5% | +13.8% |
| Oct 27, 2026 | +0.9% | +13.9% |
| Nov 3, 2026 | −0.4% | +11.6% |
| Nov 10, 2026 | +0.0% | +11.0% |
| Nov 11, 2026 | +0.2% | +12.4% |
Each disclosed stock purchase buys the midpoint of its reported range at that day's close, and sales sell it; returns are time-weighted and include dividends. Members report ranges rather than exact amounts and can file up to 45 days after a trade, so this is an estimate, not Tuberville's actual return. Based on 15 holdings as of Nov 11, 2026.
Committees
Trades in industries these committees oversee are flagged as committee overlaps.
- Agriculture
- Armed Services
- HELP
- Veterans' Affairs
- Aging
Committee overlaps
Trades in an industry overseen by a committee Tuberville sits on. An overlap is a fact about the trade, not evidence of wrongdoing.
- HELP CommitteeSold (full) Pfizer PFE$15K–$50K · traded Jun 8, 2026
- Armed Services CommitteeSold (full) Lockheed Martin LMT$15K–$50K · traded Jun 8, 2026
- HELP CommitteeSold (full) Amgen AMGN$15K–$50K · traded Apr 15, 2025
- HELP CommitteeSold (full) Bristol-Myers Squibb Company BMY$1K–$15K · traded Apr 15, 2025
- HELP CommitteeSold (full) Eli Lilly and Company LLY$15K–$50K · traded Apr 15, 2025
- Agriculture CommitteeSold (full) Archer-Daniels-Midland Company ADM$15K–$50K · traded Apr 15, 2025
Most-traded stocks
- CLF Cleveland-Cliffs Inc.923359
- X United States Steel Corporation471037
- PYPL PayPal Holdings, Inc.421725
- INTC Intel Corp.261412
- QCOM QUALCOMM Incorporated261313
- MSFT Microsoft Corporation24717
- TXN Texas Instruments Incorporated21813
- ECOM ChannelAdvisor Corporation211011
- GOLD Gold.com, Inc.19127
- OXY Occidental Petroleum Corporation19514
All trades
- Jul 16, 2026$1K–$15K
Sold (full) Westinghouse Air Brake Technologies WAB
$1K–$15K · Traded Jun 9, 2026 · disclosed Jul 16, 2026
- Jul 16, 2026$1K–$15K
Sold (full) ACN - Accenture plc Class A Ordinary Shares (Ireland)
$1K–$15K · Traded Jun 8, 2026 · disclosed Jul 16, 2026 · Joint
- Jul 16, 2026$15K–$50K
$15K–$50K · Traded Jun 8, 2026 · disclosed Jul 16, 2026 · Joint
Got $1K from the company’s PAC - Jul 16, 2026$15K–$50K
$15K–$50K · Traded Jun 8, 2026 · disclosed Jul 16, 2026 · Joint
Committee overlap: HELP - Jul 16, 2026$15K–$50K
Sold (full) NextEra Energy NEE
$15K–$50K · Traded Jun 8, 2026 · disclosed Jul 16, 2026 · Joint
- Jul 16, 2026$15K–$50K
$15K–$50K · Traded Jun 8, 2026 · disclosed Jul 16, 2026 · Joint
- Jul 16, 2026$15K–$50K
Sold (full) The Procter & Gamble Company PG
$15K–$50K · Traded Jun 8, 2026 · disclosed Jul 16, 2026 · Joint
- Jul 16, 2026$15K–$50K
Sold (full) Lockheed Martin LMT
$15K–$50K · Traded Jun 8, 2026 · disclosed Jul 16, 2026 · Joint
Committee overlap: Armed ServicesGot $2K from the company’s PAC - Jul 16, 2026$1K–$15K
Sold (full) Tractor Supply Company TSCO
$1K–$15K · Traded Jun 8, 2026 · disclosed Jul 16, 2026 · Joint
- Jul 16, 2026$15K–$50K
Sold (full) American Water Works Company AWK
$15K–$50K · Traded Jun 8, 2026 · disclosed Jul 16, 2026 · Joint
- Jul 16, 2026$15K–$50K
$15K–$50K · Traded Jun 8, 2026 · disclosed Jul 16, 2026 · Joint
- Jan 15, 2026$1K–$15K
$1K–$15K · Traded Dec 17, 2025 · disclosed Jan 15, 2026
- Jan 15, 2026$15K–$50K
Bought State Street Health Care Select Sector SPDR ETF XLV
$15K–$50K · Traded Dec 17, 2025 · disclosed Jan 15, 2026
- Jan 15, 2026$15K–$50K
Bought State Street Consumer Staples Select Sector SPDR ETF XLP
$15K–$50K · Traded Dec 17, 2025 · disclosed Jan 15, 2026
- Jan 15, 2026$50K–$100K
$50K–$100K · Traded Dec 17, 2025 · disclosed Jan 15, 2026
- Jan 15, 2026$15K–$50K
Bought State Street Utilities Select Sector SPDR ETF XLU
$15K–$50K · Traded Dec 17, 2025 · disclosed Jan 15, 2026
- Nov 15, 2025$15K–$50K
Sold (full) BIRMINGHAM ALA GO WTS SER. 2018 B Rate/Coupon: 5.0% Matures: 12/01/2043
$15K–$50K · Traded Oct 7, 2025 · disclosed Nov 15, 2025 · Joint
- Nov 15, 2025$15K–$50K
$15K–$50K · Traded Oct 7, 2025 · disclosed Nov 15, 2025 · Joint
- Nov 15, 2025$15K–$50K
$15K–$50K · Traded Oct 7, 2025 · disclosed Nov 15, 2025 · Joint
- Nov 15, 2025$15K–$50K
$15K–$50K · Traded Oct 7, 2025 · disclosed Nov 15, 2025 · Joint
- Nov 15, 2025$15K–$50K
$15K–$50K · Traded Oct 7, 2025 · disclosed Nov 15, 2025 · Joint
- Nov 15, 2025$15K–$50K
$15K–$50K · Traded Oct 7, 2025 · disclosed Nov 15, 2025 · Joint
- Nov 15, 2025$15K–$50K
$15K–$50K · Traded Oct 7, 2025 · disclosed Nov 15, 2025 · Joint
- May 15, 2025$15K–$50K
$15K–$50K · Traded Apr 15, 2025 · disclosed May 15, 2025 · Joint
- May 15, 2025$15K–$50K
$15K–$50K · Traded Apr 15, 2025 · disclosed May 15, 2025 · Joint
Committee overlap: HELP - May 15, 2025$1K–$15K
Sold (full) Bristol-Myers Squibb Company BMY
$1K–$15K · Traded Apr 15, 2025 · disclosed May 15, 2025
Committee overlap: HELP - May 15, 2025$15K–$50K
$15K–$50K · Traded Apr 15, 2025 · disclosed May 15, 2025 · Joint
- May 15, 2025$15K–$50K
$15K–$50K · Traded Apr 15, 2025 · disclosed May 15, 2025 · Joint
- May 15, 2025$15K–$50K
$15K–$50K · Traded Apr 15, 2025 · disclosed May 15, 2025 · Joint
Got $1K from the company’s PAC - May 15, 2025$15K–$50K
Sold (full) PayPal Holdings PYPL
$15K–$50K · Traded Apr 15, 2025 · disclosed May 15, 2025
- May 15, 2025$50K–$100K
Bought iShares Broad USD Investment Grade Corporate Bond ETF USIG
$50K–$100K · Traded Apr 15, 2025 · disclosed May 15, 2025
- May 15, 2025$15K–$50K
Sold (full) Constellation Brands STZ
$15K–$50K · Traded Apr 15, 2025 · disclosed May 15, 2025 · Joint
- May 15, 2025$15K–$50K
$15K–$50K · Traded Apr 15, 2025 · disclosed May 15, 2025 · Joint
- May 15, 2025$15K–$50K
Sold (full) Eli Lilly and Company LLY
$15K–$50K · Traded Apr 15, 2025 · disclosed May 15, 2025 · Joint
Committee overlap: HELP - May 15, 2025$15K–$50K
$15K–$50K · Traded Apr 15, 2025 · disclosed May 15, 2025 · Joint
- May 15, 2025$15K–$50K
$15K–$50K · Traded Apr 15, 2025 · disclosed May 15, 2025 · Joint
- May 15, 2025$15K–$50K
Sold (partial) The Goldman Sachs Group GS
$15K–$50K · Traded Apr 15, 2025 · disclosed May 15, 2025 · Joint
- May 15, 2025$15K–$50K
Sold (full) Archer-Daniels-Midland Company ADM
$15K–$50K · Traded Apr 15, 2025 · disclosed May 15, 2025 · Joint
Committee overlap: Agriculture - May 15, 2025$15K–$50K
Sold (full) JPMorgan Chase & JPM
$15K–$50K · Traded Apr 15, 2025 · disclosed May 15, 2025 · Joint
Got $4K from the company’s PAC - Feb 14, 2025$15K–$50K
$15K–$50K · Traded Jan 10, 2025 · disclosed Feb 14, 2025 · Joint
- Feb 14, 2025$15K–$50K
$15K–$50K · Traded Jan 10, 2025 · disclosed Feb 14, 2025 · Joint
- Feb 14, 2025$1K–$15K
Sold (full) Carrier Global CARR
$1K–$15K · Traded Jan 10, 2025 · disclosed Feb 14, 2025 · Joint
- Feb 14, 2025$15K–$50K
Sold (full) Tractor Supply Company TSCO
$15K–$50K · Traded Jan 10, 2025 · disclosed Feb 14, 2025 · Joint
- Feb 14, 2025$15K–$50K
Sold (full) Texas Instruments TXN
$15K–$50K · Traded Jan 10, 2025 · disclosed Feb 14, 2025 · Joint
- Feb 14, 2025$15K–$50K
$15K–$50K · Traded Jan 10, 2025 · disclosed Feb 14, 2025 · Joint
- Nov 15, 2024$15K–$50K
Sold (full) Honeywell International HON
$15K–$50K · Traded Oct 29, 2024 · disclosed Nov 15, 2024 · Joint
- Nov 15, 2024$15K–$50K
Sold (full) Johnson & Johnson JNJ
$15K–$50K · Traded Oct 29, 2024 · disclosed Nov 15, 2024 · Joint
- Nov 15, 2024$15K–$50K
$15K–$50K · Traded Oct 29, 2024 · disclosed Nov 15, 2024 · Joint
- Nov 15, 2024$15K–$50K
$15K–$50K · Traded Oct 29, 2024 · disclosed Nov 15, 2024 · Joint
- Nov 15, 2024$15K–$50K
Sold (full) The Travelers Companies TRV
$15K–$50K · Traded Oct 29, 2024 · disclosed Nov 15, 2024 · Joint
From periodic transaction reports Tuberville filed under the STOCK Act. Amounts are the ranges members report, and trades can be disclosed up to 45 days after they happen. Nothing here is investment advice.